Contents
Introduction
I finally finished my implementation of the pandemic board game (original post). I didn’t focus on making the implementation fast, so it wasn’t much of a surprise to see that it could only play about 7 games per second. I want to be able to run search algorithms to win each game, and there’s many trillions of possible games. 7 games per second isn’t going to get through all of those in a hurry, so I took the opportunity to learn more about C# performance and profiling while speeding it up.
In this post I’ll show a small diary of my progress, learnings and mistakes. In the end, I manage to run over 100 games per second. This won’t be a deep dive into profiling or C#, but rather a practical example of using profilers to guide performance improvements. There are plenty of resources online that cover how to use various profilers. See the references at the end of this post for a few. If you want to skip the diary and just see a list of performance improvements and lessons learned, skip to I made it!.
As part of this project, I read Writing High-Performance .NET Code 1 by Ben Watson. It helped me understand what to look for in the profiler results. It’s a little dated now (C#7 was the latest at the time of writing), but I still found a large amount of useful information, which I’ll add throughout this post.
What I’m optimising
The game
If you’re unfamiliar with Pandemic, here’s a very simplified version of it:
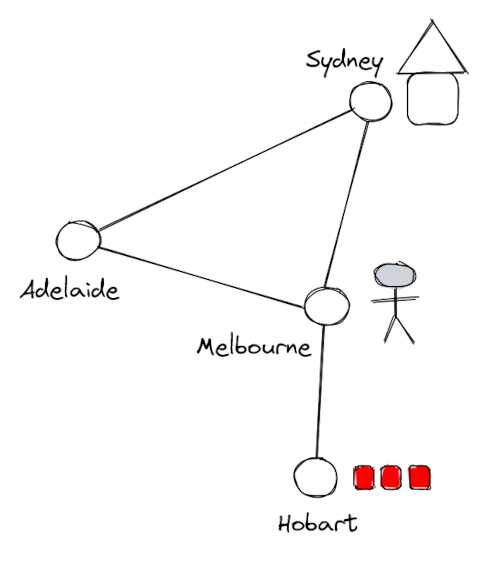
The goal of all players is to discover the cure to 4 diseases. Throughout the game, disease cases emerge and spread across the world. If the diseases spread too widely, the players lose. Therefore, the players must balance their efforts between treating disease cases, and discovering their cures.
The image above demonstrates what the game board looks like. A player is currently in Melbourne. There is a high level of ‘red’ disease in Hobart, represented by the three disease cubes there. There’s a research station in Sydney. Diseases are cured by players at research stations, by spending cards that they pick up at the end of each turn.
You can find all the rules online, and play online at https://boardgamearena.com/gamepanel?game=pandemic.
My code
The code I’m optimising starts at this commit, where I’ve just added a benchmarking and profiling app.
The pseudocode of what I’m trying to optimise:
while True:
  game = newGame()
  while game not over:
    move = agent.next_move(game)
    game = game.do(move)
The agent I want to optimise is a greedy agent, which tries all legal moves from each state, and picks the move that results in the best game state. ‘Best’ is determined by a score that I coded. The greedy agent looks a bit like this:
class GreedyAgent:
  def move(game):
    for move in game.legal_moves():
      if score(game, move) > best:
        best = move
    return best

  def score(game, move):
    """ A combination of things, including:

      - How many disease cubes are on cities?
      - How many diseases have been cured?
      - Does any player have enough cards to cure a disease?
      - How far are players away from important cities?
    """
    ...
Progress log
Plan
The performance book 1 has a short chapter that can be used as a run sheet on how to improve performance, which I decided to follow as a starting point. My adaptation of the run sheet:
- define a performance goal & metrics
- my goal: 100 games per second, on my regular development machine, according to benchmarks
- create an environment that allows you to run repeatable benchmarks & profiles
- I created a quick console app that could do fixed-time runs for profiling, and run benchmarks using BenchmarkDotNet: my benchmarking app
- profile and analyse (I’ll use Rider’s profiling tools 2)
- CPU usage
- memory usage, time spent by the garbage collector (GC)
- time spent in JIT
- async/threads
- look for the biggest time consumers, use the performance book’s advice to reduce them
- repeat 3 & 4 until your performance goal is achieved
My benchmark gives a single mean time per game figure when it’s done. To
measure the performance gain from each change, I’ll compare the time per game
before and after the change.
Percent improvement = 100 * (time per game before change / time after) - 100.
Round 1: from 7 to 12 games/sec
The performance book 1 starts by describing the importance of understanding
how memory allocation and the garbage collector (GC) 3 work in .NET. Therefore I started this round by
looking at allocations. The most allocations by size were (city, distance)
tuples, in the
ClosestResearchStationTo
method. This method does a breadth-first search from the given city, until
it finds a city with a research station. It uses a hash set to store visited
cities, and a queue to enqueue the next neighbouring cities to visit.

Given there’s a constant 48 cities in the game, it was straightforward to
convert this method to use simple integer arrays.
This resulted in a 23% improvement. The biggest saving was actually from removing
the HashSet, as the app was spending about 20% of its time looking for items
in the set. Look up “Contains” in the HashSet implementation
to see why. Although array and hash set lookup is constant time (O(1)),
there’s a large constant in the hash set implementation being hidden by that Big
O notation.
There were no more (city, distance) tuples being allocated, however the time
spent in GC was still about 10%. I think the reason for this is due to the .NET
GC design - as long as the memory you allocate is out of scope by the next GC,
it won’t affect the time the GC takes to run. The lesson here, as mentioned in
the performance book, is to keep object lifetimes as short as possible, ensuring
they are collected while still in generation 0 3.
The next highest allocations were of
System.Collections.Immutable.ImmutableDictionary+<get_Values>d__27<Colour, Int32>,
coming from the
MaxNumCubes
method. My understanding of what’s happening here is that each call to
ImmutableDictionary.Values instantiates a new iterator that traverses all items
in the dictionary. This is due to Values being a iterator method.
(ImmutableDictionary.Values implementation).
I tried to find the naming convention for generated code like this, but I
couldn’t find an authoritative source. This
JetBrains article
talks about code that gets generated from lambdas and closures, but doesn’t
mention where the names of the generated code classes/methods come from. It
seems to be something like SomeClass+<method that generates code>x__id<types>.
x appears to indicate the type, eg. c for class, d for delegate (?). The
id is a number to distinguish it from other generated code.
In
f172f390,
I access each dictionary element directly, instead of iterating over all
elements. I also remove the use of the LINQ Max method. These changes gave a
36% speedup.
Round 2: from 12 to 20 games/sec
I was on a roll with following memory allocations, so I continued in this round.
I made 60% improvement by removing LINQ in hot paths:
- PlayerHandScore: group, filter, sum
- PenaliseDiscards: filter, cast, group
- IsCured: search
- HasEnoughToCure: group, count, search
The last change alone gave a 40% speedup in benchmarks, but only about 10%
during profiling runs. Running RunSamples for longer didn’t affect the average
game time. There must be something different about how the benchmark app is
coded/built/run that produces a bigger improvement than the ‘samples’ run. I
couldn’t figure it out :(. For now, here’s how to reproduce the difference:
git checkout 08a63cd
./runBenchmarks.sh    # 68.67 ms/game
./runSamples.sh       # 12.40/sec (80.65ms/game)
git checkout 6055aed
./runBenchmarks.sh    # 50.72 ms/game (35.4% speedup)
./runSamples.sh       # 13.15/sec (76.05ms/game, 6% speedup)
Facepalm #1: different programs’ profiles can look the same
For a while I was confused as to why playing random games was so much faster than greedy games. Greedy games were spending about 50% of their CPU time making moves, and the other 50% searching for the best move. I thought this meant that greedy games should be running at ~50% of random speed. They actually ran at less than 1% of the speed. I’d had my head stuck in the profiler for too long - the two agents work quite differently, which isn’t immediately obvious in the profiler results. The greedy agent tries all possible moves before choosing the best one, while the random agent immediately plays a random move. The greedy agent thus spends a lot less time progressing the game than the random agent.
This can be seen by profiling with tracing. Tracing counts calls to every method in the program:
- greedy agent calls to
Do(action): 4358. Random agent: 9550. - greedy agent calls to
CreateNewGame(): 2. Random agent: 226
The random agent makes on average 42 calls to Do(action) per game, whereas the
greedy agent makes over 2000.
Round 3: from 20 to 50 games/sec
I tried making a few more changes to reduce allocations, but these didn’t have much of an effect. For this round, I decided to focus on CPU time instead.
45%: 1066696: looking up cities by array index instead of from a name:city dictionary. Similar to the hash set in round 1, looking up cities with a dictionary is much more expensive than an array.
40%: Storing cubes counts as integer fields rather than colour:int dictionaries. Yet again, getting rid of expensive dictionary lookups.
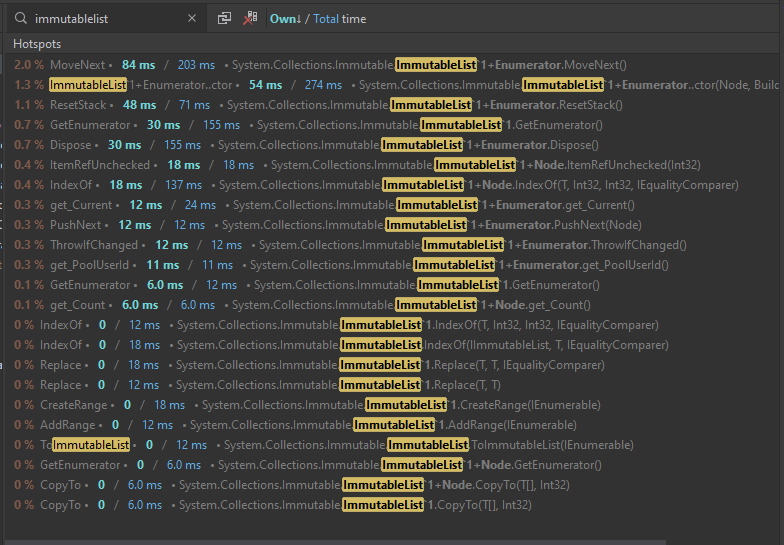
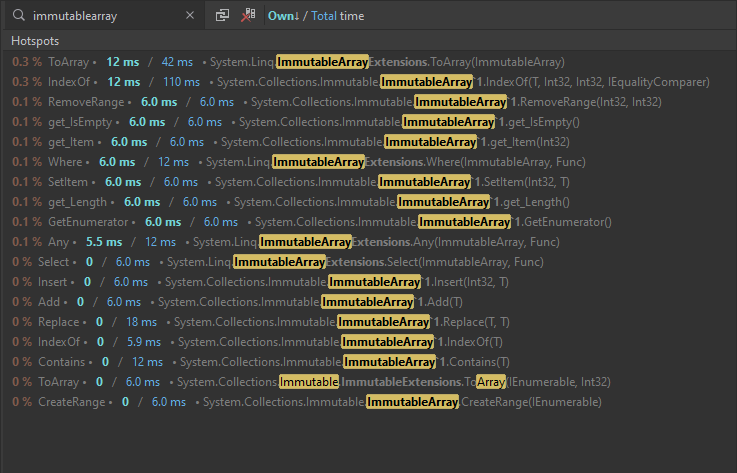
25%: use ImmutableArray instead of ImmutableList for Players. ImmutableArray is more targeted at performance than ImmutableList. There’s advice in this post on when to use each. In this case, the top reason appears to be better performance when iterating over the array in performance critical sections. A before & after profile shows that the list consumes more time dealing with enumerators than the array:
Facepalm #2 - what made it go faster?
This feels really dumb to have to explain, but I was stumped for an embarrassingly long time by it. This section is for future me.
I was having trouble explaining where the performance gains were coming from when comparing the benchmarks and the profile results.
I was measuring performance improvement by benchmark results, which gave me a throughput figure (games per second). However, when running the profiler, I ran the app for a fixed amount of time. This made it seem as though the benchmark was giving better results than the profiler run. I’ll try to explain with pictures.
Say your app repeatedly calls two methods, A and B. You benchmark the app, and find that its throughput is 10 per second. To profile it, you run the app for 1 second:
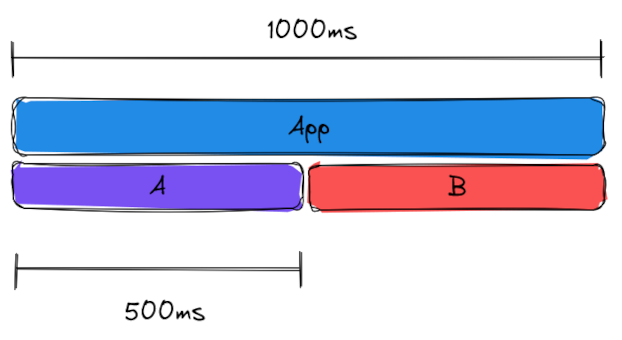
You then optimise A, and measure again. The benchmark shows a 33% improvement - throughput is now 13.3 per second. However, the profile looks like this:
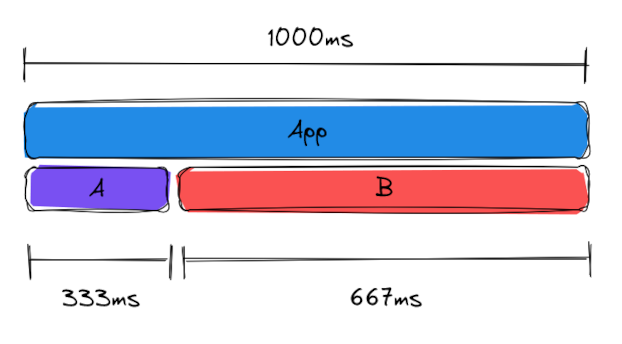
It looks as though you’ve made A 167ms faster, which is 16.7% of the time the app runs. Where’s the rest of the 33% improvement?
It’s there, but profiling the app for a fixed amount of time makes it harder to see. You can find the throughput improvement by looking at the change of time spent in B, since B’s code has not been modified.
Let the initial number of calls to B = x. Then:
xB = 0.5s
The optimisation of A resulted in some change in throughput of the whole
application, which I’ll call y. The app now spends 0.666s in B. So:
yxB = 0.666s
We want to know y, so divide both sides by xB, which we know is 0.5s:
yxB / xB = y = 0.666 / 0.5 = 1.33
There’s the 33% increase in throughput.
It’s easier to see where the performance gain was made by running the app for a certain number of iterations. Say you run it for 10 iterations. Before the optimisation, the run takes 1 second. Afterwards, it takes 750ms. The 33% increase in throughput of the app is immediately obvious (1000 / 750 = 1.33), and the 250ms saved all comes from A.
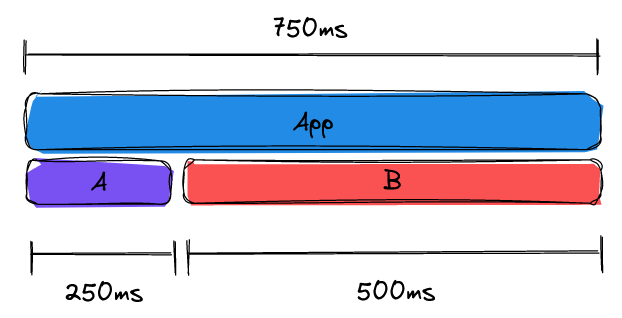
There are still times when benchmarking may give quite different results to the profiling run, as happened in round 2.
Round 4: from 50 to … 200!? Oh…
I gained an easy 22% from:
- Player.HasEnoughToCure: iterate over cards directly instead of using iterator method
- Deck: use pre-sized array instead of list
Then, yielding available commands instead returning a list caused a massive 310% improvement! Or, so I thought…
Mistake! (facepalm #3)
I felt very satisfied with the great leap in performance, and assumed that it all came from removing the repeated construction of the list. Later, I just happened to notice that I had changed the way the greedy agent was playing games. It was now making players pass their turn. It’s a completely valid move, but hardly ever useful. As a result, it was losing games much faster than before.
Lesson learned - have tests in place that ensure your app behaves as expected, before making performance changes. Be wary of large performance changes that you can’t explain. Also, don’t put me in charge of a paperclip factory.
Round 5: from 78 to 124
The biggest improvement in this round came from improving an algorithm, rather than micro-optimisations. When computing the score for research stations, I was originally running a breadth-first search for the closest stations to the ‘best’ cities, scoring higher the closer they were. Instead of running this search, I pre-computed the scores that cities would contribute. This gave a 27% boost.
Finally, a couple more quick wins to finish off:
I made it!
I achieved my goal of 100 games per second! I could have kept going - I had become addicted to the hit of seeing the benchmark score go up. That’s a good reason to set a goal beforehand.
All changes, ranked by % speedup
- 45% look up cities by array index instead of name:city dictionary
- 40% store cubes counts as integer fields rather than colour:int dictionaries
- 40% remove LINQ: HasEnoughToCure: group, count, search
- 36% remove iterator and LINQ: MaxNumCubes
- 27% replace search with pre-computed scores per city
- 25% use ImmutableArray instead of ImmutableList for Players
- 23% use integer array instead of HashSet
- 22%:
- 20%
- 20% use an iterator method instead of building and returning a list
- 10% inline loop & method call
- 6% remove LINQ: sum
What kind of changes improved performance?
The changes above boil down to a few simple dot points of advice. Measure your application first before blindly applying these changes! The profiler will tell you where making these changes will have the biggest benefit.
- replace LINQ with simple loops and arrays
- where possible, replace collections with arrays
- use ImmutableArray instead of ImmutableList
- pre-size arrays and collections
- pre-compute values that are known before runtime
Practical lessons learned
In addition learning some technicalities of profiling and optimising C# code, I learned a few valuable practical lessons while working on this project:
- Profile and benchmark in using the same build & run config
- there can be large differences in performance between Release and Debug modes - benchmark and profile in Release mode!
- benchmark.net doesn’t allow you to bench in Debug
- If you get a massive increase in performance that looks too good to be true, it might be. Make sure you’ve got tests in place that catch any unintended changes in application behaviour. See facepalm #3.
- If you haven’t focused on performance, then there will likely be many significant gains to be made with little effort. Set yourself a deadline, and just follow the profiler.
- Different profilers yield slightly different results, since they are more/less intrusive on your application. For example, the timeline profile may show less time spend in GC than the memory profiler.
- Rider’s profilers show all threads by default, including runtime threads. If your app is single threaded, select the main thread to reduce noise in the profiling results.
- From the perf book 1: C# libraries are usually made with robustness and convenience in mind, not performance. For example, LINQ. If you need performance, you’ll likely have to use different libraries, or write your own (usually more verbose) code.
- Stay aware of what you’re profiling - different programs can look similar in a profiler, but behave very differently. See facepalm #1.
References
-
Writing High-Performance .NET Code, 2nd ed. https://www.writinghighperf.net ↩︎ ↩︎ ↩︎ ↩︎
-
JetBrains Rider profiling tutorial series: a small introduction to profiling in Rider, with demo apps ↩︎